Datasheet 搜索 > 8位微控制器 > Microchip(微芯) > AT89C5131A-S3SUM 数据手册 > AT89C5131A-S3SUM 其他数据使用手册 2/7 页
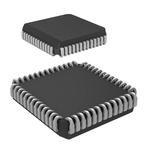
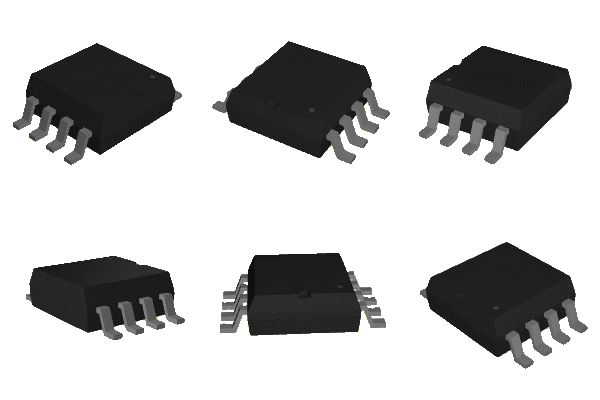 器件3D模型
¥ 64.67
AT89C5131A-S3SUM 其他数据使用手册 - Microchip(微芯)
制造商:
Microchip(微芯)
分类:
8位微控制器
封装:
PLCC-52
描述:
AT89C5131 系列 48 MHz 32 KB 闪存 1.25 KB SRAM 8位 微控制器 - PLCC-52
Pictures:
3D模型
符号图
焊盘图
引脚图
产品图
页面导航:
封装尺寸在P3
型号编码规则在P7
技术参数、封装参数在P2
导航目录
AT89C5131A-S3SUM数据手册
Page:
of 7 Go
若手册格式错乱,请下载阅览PDF原文件

FE-5131A Page-2
DESCRIPTION
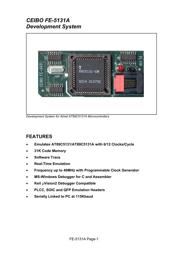
Ceibo FE-5131A is a development system that supports ATMEL AT89C5131
and AT89C5131A microcontrollers with 6/12 clocks/cycle at any frequency
allowed by the devices. It is serially linked to a PC or compatible systems and
can emulate the microcontrollers using the built-in clock generator. Emulation
is carried out by loading the system with the user software and an embedded
monitor program. FE-5131A locates the monitor in the upper 1K of the code
memory space. Two working modes are available: real-time and simulator. In
the real-time mode the user software is executed transparently and without
interfering with the microcontroller speed. Breakpoints can be added to stop
program execution at a specific address. Real time trace is available. The
simulation mode does not implement all the chip options and it is
intended only for software debugging of the basic 8051 functions. Use the
system in emulation mode. The simulation mode is used to debug the
software without any hardware. FE-5131A may be disconnected while using
the simulation mode. The software includes C and Assembler Source Level
Debugger, On-line Assembler and Disassembler, Trace, Conditional
Breakpoints and many other features. The system is supplied with Windows
debugger software, RS-232 cable and a power supply.
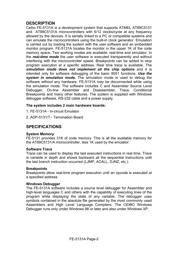
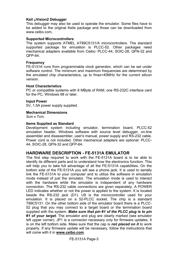
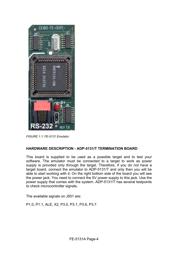
The system includes 2 main hardware boards:
1. FE-5131A - In-circuit Emulator
2. ADP-5131/T - Termination Board
SPECIFICATIONS
System Memory
FE-5131 provides 31K of code memory. This is all the available memory for
the AT89C5131/A microcontroller, less 1K used by the emulator.
Software Trace
Trace can be used to display the last executed instructions in real time. Trace
is variable in depth and shows backward all the sequential instructions until
the last branch instruction occurred (LJMP, ACALL, DJNZ, etc.).
Breakpoints
Breakpoints allow real-time program execution until an opcode is executed at
a specified address.
Windows Debugger
The FE-5131A software includes a source level debugger for Assembler and
high-level languages C and others with the capability of executing lines of the
program while displaying the state of any variable. The debugger uses
symbols contained in the absolute file generated by the most commonly used
Assemblers and High Level Language Compilers. The CEIBO Windows
Debugger runs only under Windows 98 or later and also under Windows XP.
器件 Datasheet 文档搜索
AiEMA 数据库涵盖高达 72,405,303 个元件的数据手册,每天更新 5,000 多个 PDF 文件
