Datasheet 搜索 > 双极性晶体管 > ON Semiconductor(安森美) > MJW3281AG 数据手册 > MJW3281AG 其他数据使用手册 6/10 页
¥ 16.267
MJW3281AG 其他数据使用手册 - ON Semiconductor(安森美)
制造商:
ON Semiconductor(安森美)
分类:
双极性晶体管
封装:
TO-247-3
描述:
互补NPN -PNP硅功率双极晶体管 Complementary NPN-PNP Silicon Power Bipolar Transistors
Pictures:
3D模型
符号图
焊盘图
引脚图
产品图
页面导航:
原理图在P2
导航目录
MJW3281AG数据手册
Page:
of 10 Go
若手册格式错乱,请下载阅览PDF原文件

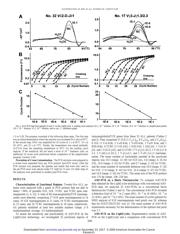
data are depicted in Figs. 2–5. Fig. 2 illustrates typical ASO-PCR
results of two different junctional regions of the TCRD and TCRG
genes obtained on the LightCycler. Fig. 2B shows the amplification
profiles. The fluorescence (F1, fluorescence channel 1 for SYBR
Green I) is depicted on the Y axis, whereas the X axis shows the
number of PCR cycles. As expected, more PCR cycles are required to
amplify target DNA in a sample containing less template DNA. For
example, it takes ⬃15 PCR cycles before fluorescence can be detected
in the highest dilution sample of patient 32, which contains the lowest
amount of template DNA (Fig. 2B, 1E-6), whereas fluorescence at a
lower dilution containing a high amount of template DNA (Fig. 2B,
1E-1) can already be measured after 5 PCR cycles. On the other hand,
samples containing a high amount of template DNA reach their
plateau after fewer cycles than those containing a smaller amount of
template DNA. When one of the PCR reactions of an MRD experi-
ment has reached its plateau, the linearity of such a reaction is lost,
and in case of a conventional ASO-PCR reaction, additional PCR
reactions will have to be performed. Because the LightCycler meas-
ures the amount of generated PCR product after every cycle, such
steps will not be required, thus saving time and manpower. After 18
(patient 32) or 24 (patient 17) cycles, target DNA is also amplified
from control BC DNA.
The interdependency between the number of PCR cycles required
to detect a template and the number of template molecules initially
present in a sample is used for the quantification of unknown samples.
To determine its relationship, a calibration graph is required (Fig. 2C).
For each sample with a known template concentration, the PCR cycle
at which the amplification enters the log linear region is determined
(starting point of the amplification curve; see Fig. 2B). The cycle
number at which an adjustable baseline (crossing line) and an ampli-
fication curve cross each other is defined as the crossing point (Fig.
2B). By plotting the crossing points of the serial dilutions against the
relative number of target molecules in the serial dilutions, a calibra-
tion curve is obtained (Fig. 2C). By varying the baseline of the
amplification curve, we determined the calibration curve with optimal
linearity, which was used for quantification of the bone marrow
follow-up samples.
Fig. 2A shows the negative derivatives of melting curve character-
istics of two different junctional regions of the TCRD and TCRG
genes at the end of the PCR reaction (35 cycles), respectively. The
two peaks (⬃83°C) represent the T
m
, i.e., the temperature at which
50% of the DNA PCR product melted. The melting curve shows only
one peak, indicating that only one target-specific PCR product was
amplified.
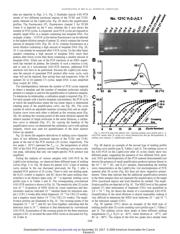
During the analysis of various samples with ASO-PCR by the
LightCycler technology, we observed three different types of melting
curves (Figs. 3–5). Fig. 3B shows for patient 121C a type of melting
curve similar to the one discussed previously for Fig. 2 after a
standard PCR protocol of 35 cycles. There is only one melting peak,
the H
2
O1 control is negative, and BC shows the same melting char-
acteristics in all dilution steps (only 10
⫺1
is depicted; melting curve
profile type A in Tables 2 and 3). The corresponding conventional
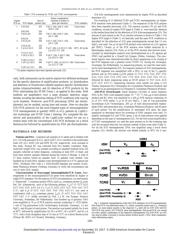
ASO-PCR reaction is shown in Fig. 3A. The sensitivity after 25 cycles
was 10
⫺4
. Evaluation of MRD levels by visual inspection and den-
sitometric analysis indicated 10
⫺2
residual blasts for remission sam-
ple 1 (CR1; 5 weeks after initial diagnosis), 10
⫺4
for CR2 (13 weeks),
and a negative result (below 10
⫺4
) for CR3 (21 weeks). The ampli-
fication profiles are illustrated in Fig. 3C. The crossing points of the
templates 10
⫺5
,10
⫺6
, and BC are close together, indicating that the
detection limit is 10
⫺4
, identical to that determined by conventional
ASO-PCR. Examination of the crossing points for the three remission
samples (CR1–3) revealed the same MRD levels as discussed for Fig.
3A (Table 4).
Fig. 4B depicts an example of the second type of melting profile
(melting curve profile type B; Tables 2 and 3). The melting curves of
the ASO-PCR on the LightCycler after 35 cycles clearly show two
different peaks, suggesting the presence of two different DNA prod-
ucts. DNA gel electrophoresis of this PCR material demonstrated (not
shown) the presence of small amplification products (primer-dimer) in
the 10
⫺5
,10
⫺6
, BC, and H
2
O1 samples, demonstrating the melting
curve characteristics on the LightCycler. Gel electrophoresis of PCR
material after 30 cycles (Fig. 4A) does not show respective primer-
dimers. These data indicate that the additional amplification product
in the three samples does not represent the amplification of the target
DNA (junctional region) and must therefore be omitted. The ampli-
fication profiles are depicted in Fig. 4C. The MRD level of this patient
(patient 27) after termination of treatment (CR1) was quantified as
2.8 ⫻ 10
⫺2
. Fig. 4A shows the results of a conventional ASO-PCR.
Quantification of the serial dilutions is almost impossible, making it
very difficult to determine the MRD level (between 10
⫺1
and 10
⫺3
)
of the remission sample (CR1).
Fig. 5B (patient 127C) shows an example of the third type of
melting profile after 35 cycles (melting curve profile type C; Tables 2
and 3). The melting curves show peaks at three different melting
temperatures (T
m
); H
2
O1 at ⬃82°C, serial dilutions at ⬃87°C, and
BC at ⬃89°C. The origins of the first two peaks have already been
Fig. 3. ASO-PCR data from patient 121C, showing melting curve profile type A. A,
ASO-PCR results after 25 cycles on a block thermocycler and gel electrophoresis; B,
melting curve analysis; C, amplification profile.
3286
QUANTIFICATION OF MRD IN ALL PATIENTS BY LIGHTCYCLER
Research.
on December 23, 2017. © 2000 American Association for Cancercancerres.aacrjournals.org Downloaded from
器件 Datasheet 文档搜索
AiEMA 数据库涵盖高达 72,405,303 个元件的数据手册,每天更新 5,000 多个 PDF 文件
