Datasheet 搜索 > 32位控制器 > ST Microelectronics(意法半导体) > STM32F405RGT6U 数据手册 > STM32F405RGT6U 其他数据使用手册 1/1 页
¥ 66.621
STM32F405RGT6U 其他数据使用手册 - ST Microelectronics(意法半导体)
制造商:
ST Microelectronics(意法半导体)
分类:
32位控制器
封装:
LQFP
描述:
STMICROELECTRONICS STM32F405RGT6U 微控制器, 32位, 高级连接和加密, ARM 皮质-M4, 168 MHz, 1 MB, 192 KB, 64 引脚, LQFP
Pictures:
3D模型
符号图
焊盘图
引脚图
产品图
页面导航:
功能描述在P1
导航目录
STM32F405RGT6U数据手册
Page:
of 1 Go
若手册格式错乱,请下载阅览PDF原文件
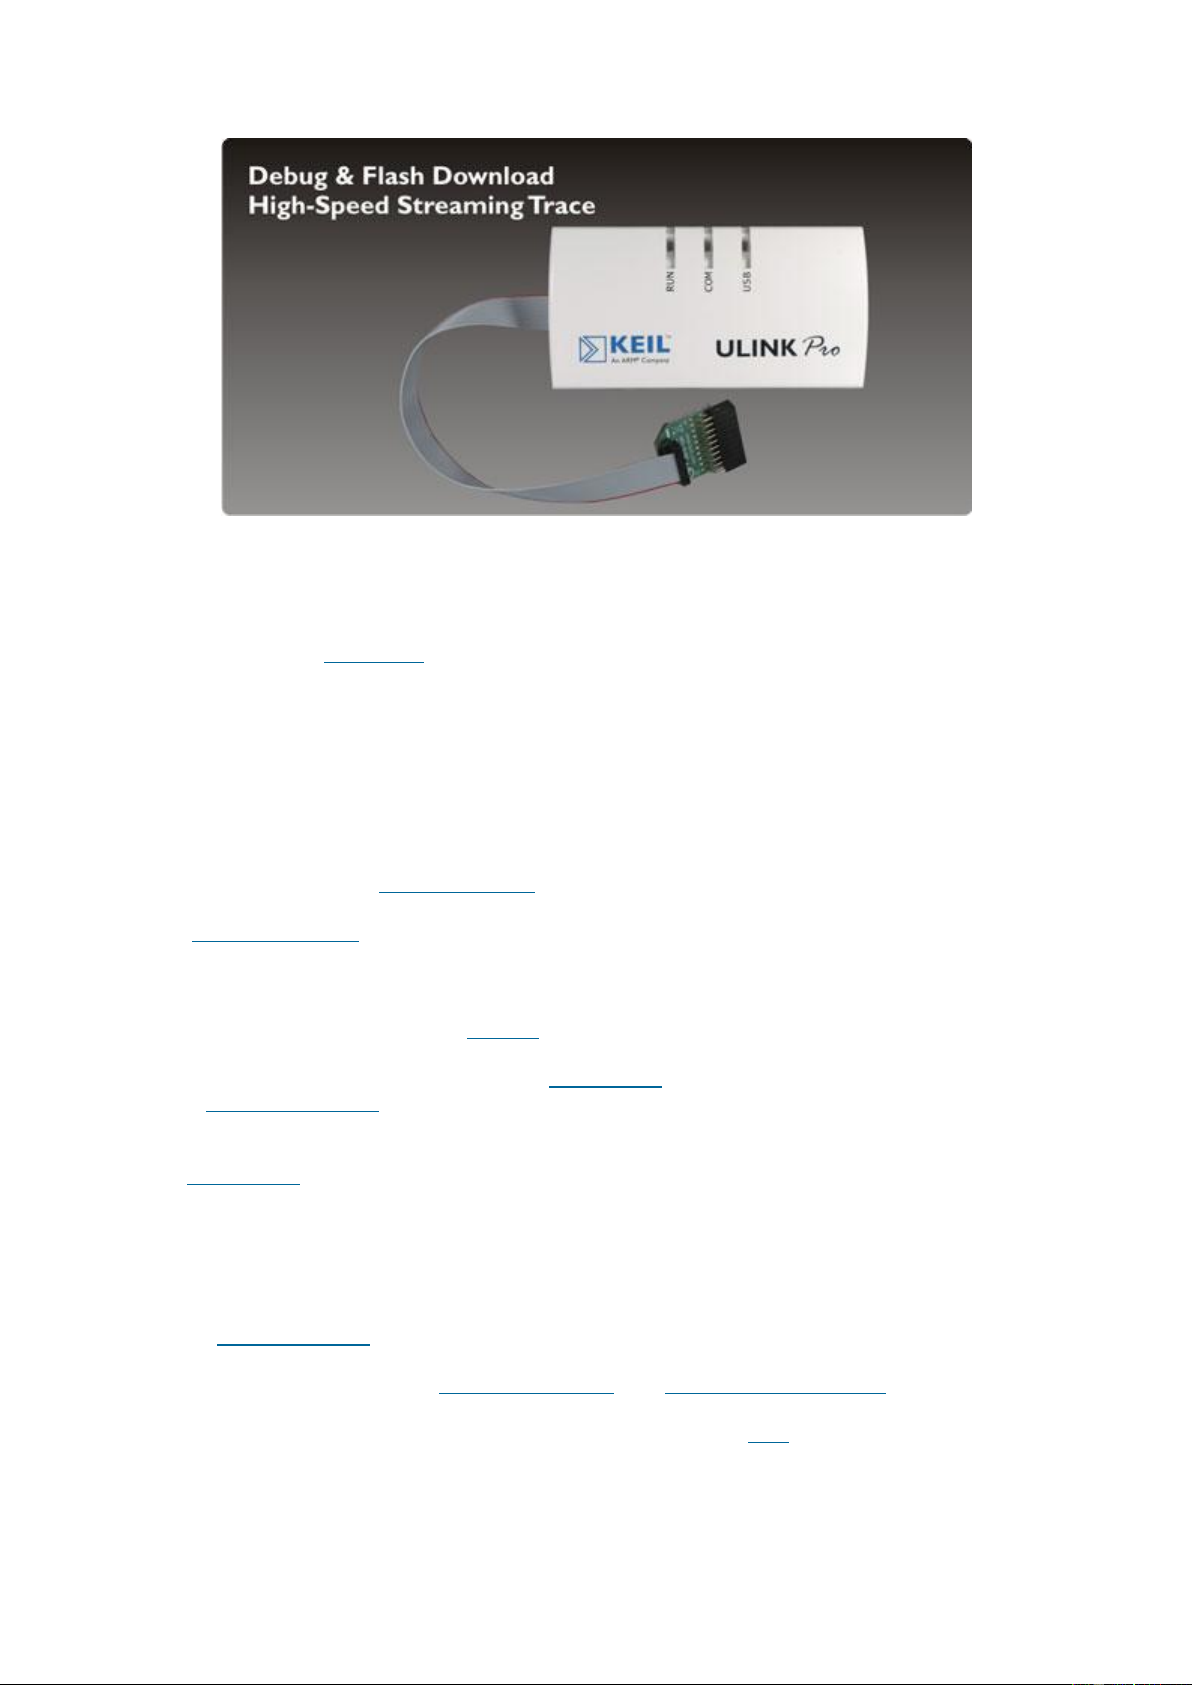
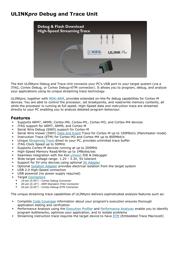
ULINKpro Debug and Trace Unit
The Keil ULINKpro Debug and Trace Unit connects your PC's USB port to your target system (via a
JTAG, Cortex Debug, or Cortex Debug+ETM connector). It allows you to program, debug, and analyze
your applications using its unique streaming trace technology.
ULINKpro, together with MDK-ARM, provides extended on-the-fly debug capabilities for Cortex-M
devices. You are able to control the processor, set breakpoints, and read/write memory contents, all
while the processor is running at full speed. High-Speed data and instruction trace are streamed
directly to your PC enabling you to analyze detailed program behaviour.
Features
Supports ARM7, ARM9, Cortex-M0, Cortex-M1, Cortex-M3, and Cortex-M4 devices
JTAG support for ARM7, ARM9, and Cortex-M
Serial Wire Debug (SWD) support for Cortex-M
Serial Wire Viewer (SWV) Data and Event Trace for Cortex-M up to 100Mbit/s (Manchester mode)
Instruction Trace (ETM) for Cortex-M3 and Cortex-M4 up to 800Mbit/s
Unique Streaming Trace direct to your PC, provides unlimited trace buffer
JTAG Clock Speed up to 50MHz
Supports Cortex-M devices running at up to 200MHz
High-Speed Memory Read/Write up to 1MBytes/sec
Seamless integration with the Keil µVision IDE & Debugger
Wide target voltage range: 1.2V - 3.3V, 5V tolerant
Support for 5V only devices using optional 5V Adapter
Optional Isolation Adapter provides electrical isolation from the target system
USB 2.0 High-Speed connection
USB powered (no power supply required)
Target Connectors
10-pin (0.05") - Cortex Debug Connector
20-pin (0.10") - ARM Standard JTAG Connector
20-pin (0.05") - Cortex Debug+ETM Connector
The unique streaming trace capabilities of ULINKpro delivers sophisticated analysis features such as:
Complete Code Coverage information about your program's execution ensures thorough
application testing and verification
Performance Analysis using the Execution Profiler and Performance Analyzer enable you to identify
program bottlenecks, optimize your application, and to isolate problems
Streaming instruction trace requires the target device to have ETM (Embedded Trace Macrocell)
器件 Datasheet 文档搜索
AiEMA 数据库涵盖高达 72,405,303 个元件的数据手册,每天更新 5,000 多个 PDF 文件
